How well do DC's red-painted bus lanes work?
Starting June 3 and ending September 27, DDOT piloted two bus lanes on H and I streets. In particular, the District painted the rightmost lanes of these streets red, and dedicated those lanes to buses between 7AM to 9:30AM and 4PM to 6:30PM. But, did those shiny, fresh coats of paint actually do anything? According to DDOT, “Preliminary data comparing June 2018 and June 2019 found improvements in bus speeds and reliability on I Street NW but not on H Street NW.” Let’s dig into that a little bit, especially keeping in mind that in NYC, the 14th street bus lanes saw immediate, dramatic improvements upon closing an entire road to traffic. Do visual demarcations that close a single lane to traffic have the same effect?
The short answer: Looking at bus speeds before/after the introduction of the lanes on H and I streets, it’s not clear to me that the lanes have measurably helped improve speeds.
Read on to learn more about what I did to come to this conclusion.
The Data
Unlike DDOT (who have presumably been archiving their bus location data since the beginning of time, and should make their archive public), a friend has been archiving every real-time bus ping since March 2019 (thanks, Mark!). The way this works is that every minute or so, any given bus will ping its latest location to a central server. Our archiving script runs on minute-ly intervals and catches those pings, saving them off into files which you can access here.
For this analysis, I look at data from March 2019 until December 31, 2019.
The methods
In order to compute speeds on these routes, I performed the following procedures on the archived data.
On each day’s file, I:
- Filtered to just records that came from one of the 5 bus lines that run along H and/or I streets: the 30N, 30S, 32, 33, 36.
- Each record has a
TripIDassociated with it that is unique to that particular trip the bus ran on that day. For each of those trips on that day, I pulled all records from that trip. - In each trip, pull out only those records that are either on H street or I street.
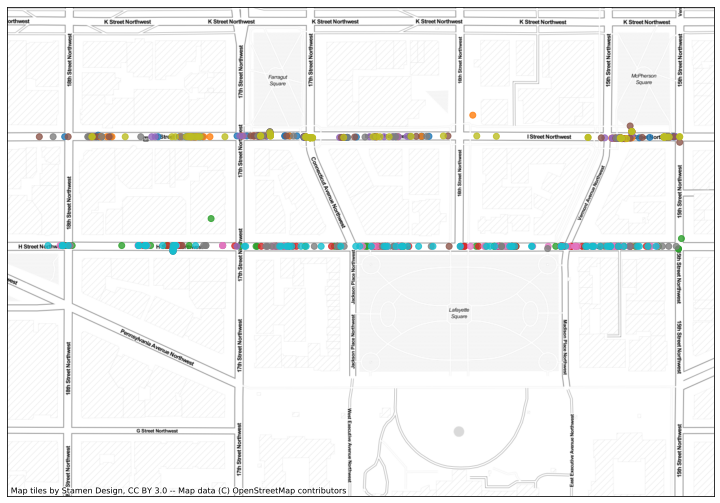
Here’s what that looked like on Tuesday, 9/2/2019. Each color is a different trip.
Then, we filter for trips on each corridor with at least 3 GPS pings (and no more than 10) within the corridor, and compute the average speed for those by taking the average rate between the last GPS point and first GPS point on the corridor. The hope is to see change over time and over all trips, so this might not be a perfect measure of speed, but if the buses start moving through this corridor faster, it should be able to pick up on that. Here’s what some of that processed data looks like from 2019-09-02, when there were 183 reported trips within the corridor that met the ‘3-10 GPS point’ criterion.
| TripID | distance | time | rate | corridor | n | start_t | end_t | |
|---|---|---|---|---|---|---|---|---|
| 124 | 991536010 | 1674.544503 | 139.0 | 12.047083 | h | 3.0 | 2019-09-02 13:31:23 | 2019-09-02 13:33:42 |
| 74 | 949148010 | 1925.530003 | 116.0 | 16.599397 | h | 3.0 | 2019-09-02 06:53:38 | 2019-09-02 06:55:34 |
| 88 | 991486010 | 1847.698704 | 137.0 | 13.486852 | i | 3.0 | 2019-09-02 12:21:33 | 2019-09-02 12:23:50 |
From here, I specifically look at the time when the bus lane rules were in place – from 7-9:30AM and 4-6:30PM on weekdays – and see what the average speed for all buses on that corridor was during those times each day.
Here’s the code: https://github.com/cmoscardi/dc_bus_stuff
Aand, the results?
At first, I was optimistic after seeing results that looked like this. This is average speeds during the AM rush hour before/after the bus lane was painted on.
| Before bus lane | After bus lane | |
|---|---|---|
| H street | 11.7 MPH | 12.9 MPH |
| I street | 11.8 MPH | 12.7 MPH |
However, the story gets more complicated when we look at average speeds by day.
What do the day-by-day speeds look like?
Really, the ambiguity here is in the following graphs. First, let’s look at H street. The below plots show average bus speeds on the corridor each day, both before and after the new lanes got painted.
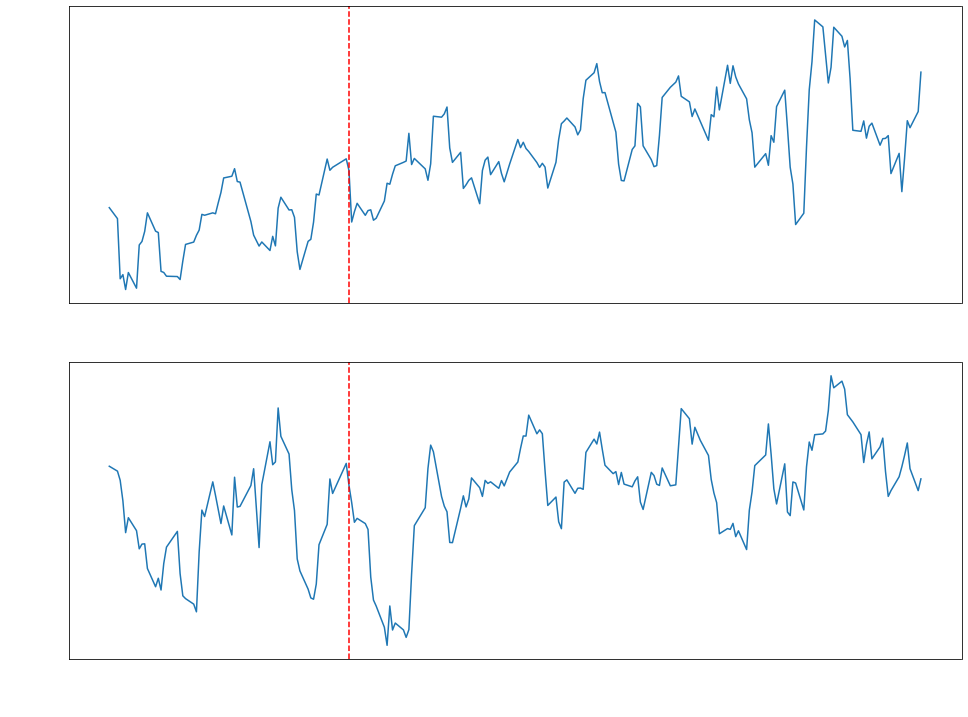
Yikes. Let’s break this out a little bit. First, the AM rush hour is categorically faster than the PM rush hour – the lowest (smoothed) daily average speed on H street is 10.5 MPH. Then, in the PM we see average speeds range from about 5.5MPH slowest… to a max of roughly 11.5 MPH!
However, what’s arguably more interesting here is the trends in both charts. In the first, we see that there is effectively no change in trend before the red dashed line and after it. In other words, the buses appear to be getting progressively faster on the mornings on H street, but it doesn’t look like the bus lanes have anything to do with it – they were already getting faster before the introduction of the bus lanes!And on the other side, during the PM rush hour, we see effectively no change. The precipitous dip in speed after the introduction of the bus lane is concerning, but that does even out by the end of the study period.
We see similar behavior on I street, but reversed.
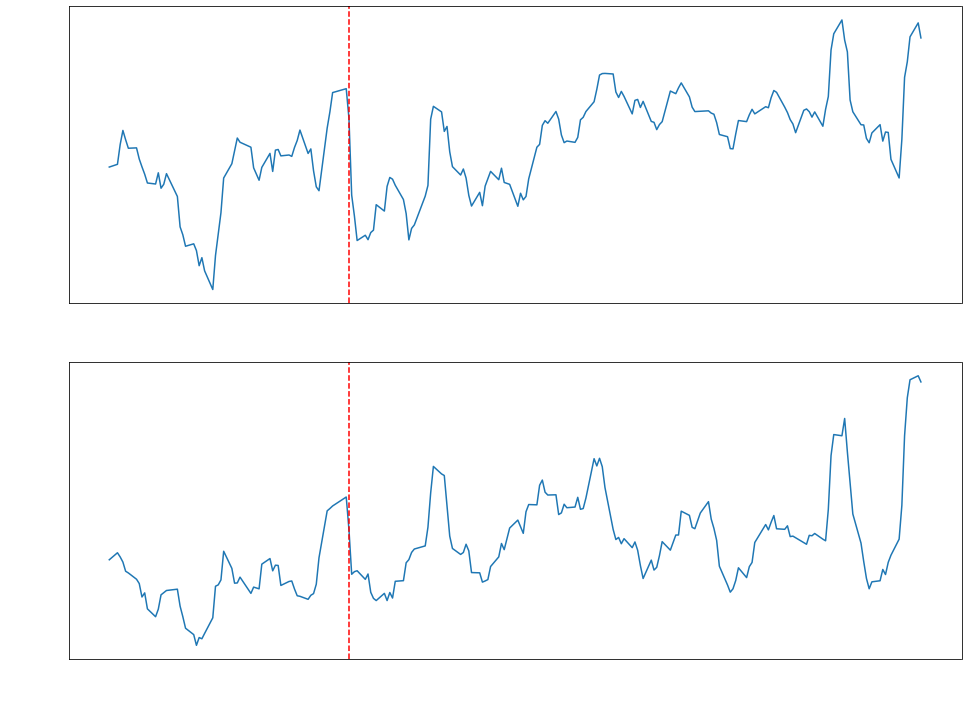
Perhaps here, it is the case that during the PM rush hour, we see some marginal improvement – it may be the case that the trend begins increasing slightly faster. It’s hard to see without a basis for comparison.
How can we dig deeper?
At this point, it would be interesting to perform a difference-in-difference experiment here. Specifically, find an area that’s similar to I street during the PM rush hour (maybe other segments of road that these bus lines share), but didn’t have a bus lane painted in. And then compare the trend of bus speeds in that area. Did those buses get similarly faster during this time, or did something “special” happen on I street (or H street) once the lane was installed?
Final thoughts
With that being said, looking at these results thus far, it’s really not clear that these bus lanes have helped the buses move faster through this corridor. Transit advocacy groups in the area have been frustrated by enforcement in the lanes – this could certainly be the underlying issue here.
As DDOT begins to install bus lanes elsewhere in the city (woohoo, 14th st NW!), I think a similar analysis to this one can help shed light on how well these measures are actually working.
Plus, on November 12, the lanes on H and I streets became permanent and enforced 7AM-7PM! Looking at the results above, you can start to see improvement. Check back in a few months and I’ll put up some graphs of how well that has been working.