Fine-tuning OCR works really well: the Statistical Abstracts of the United States
Several years ago, a friend working on his PhD asked if I could help digitize the Statistical Abstracts of the United States in order to spare him the hassle of going through these documents page-by-page. These abstracts are a historical Census Bureau dataset that includes many interesting things, like how many chickens were in the United States in 1920. If you want to know, there were ~360 million chickens in the United States in 1920. (The Chicken Census is now conducted and published by USDA.)
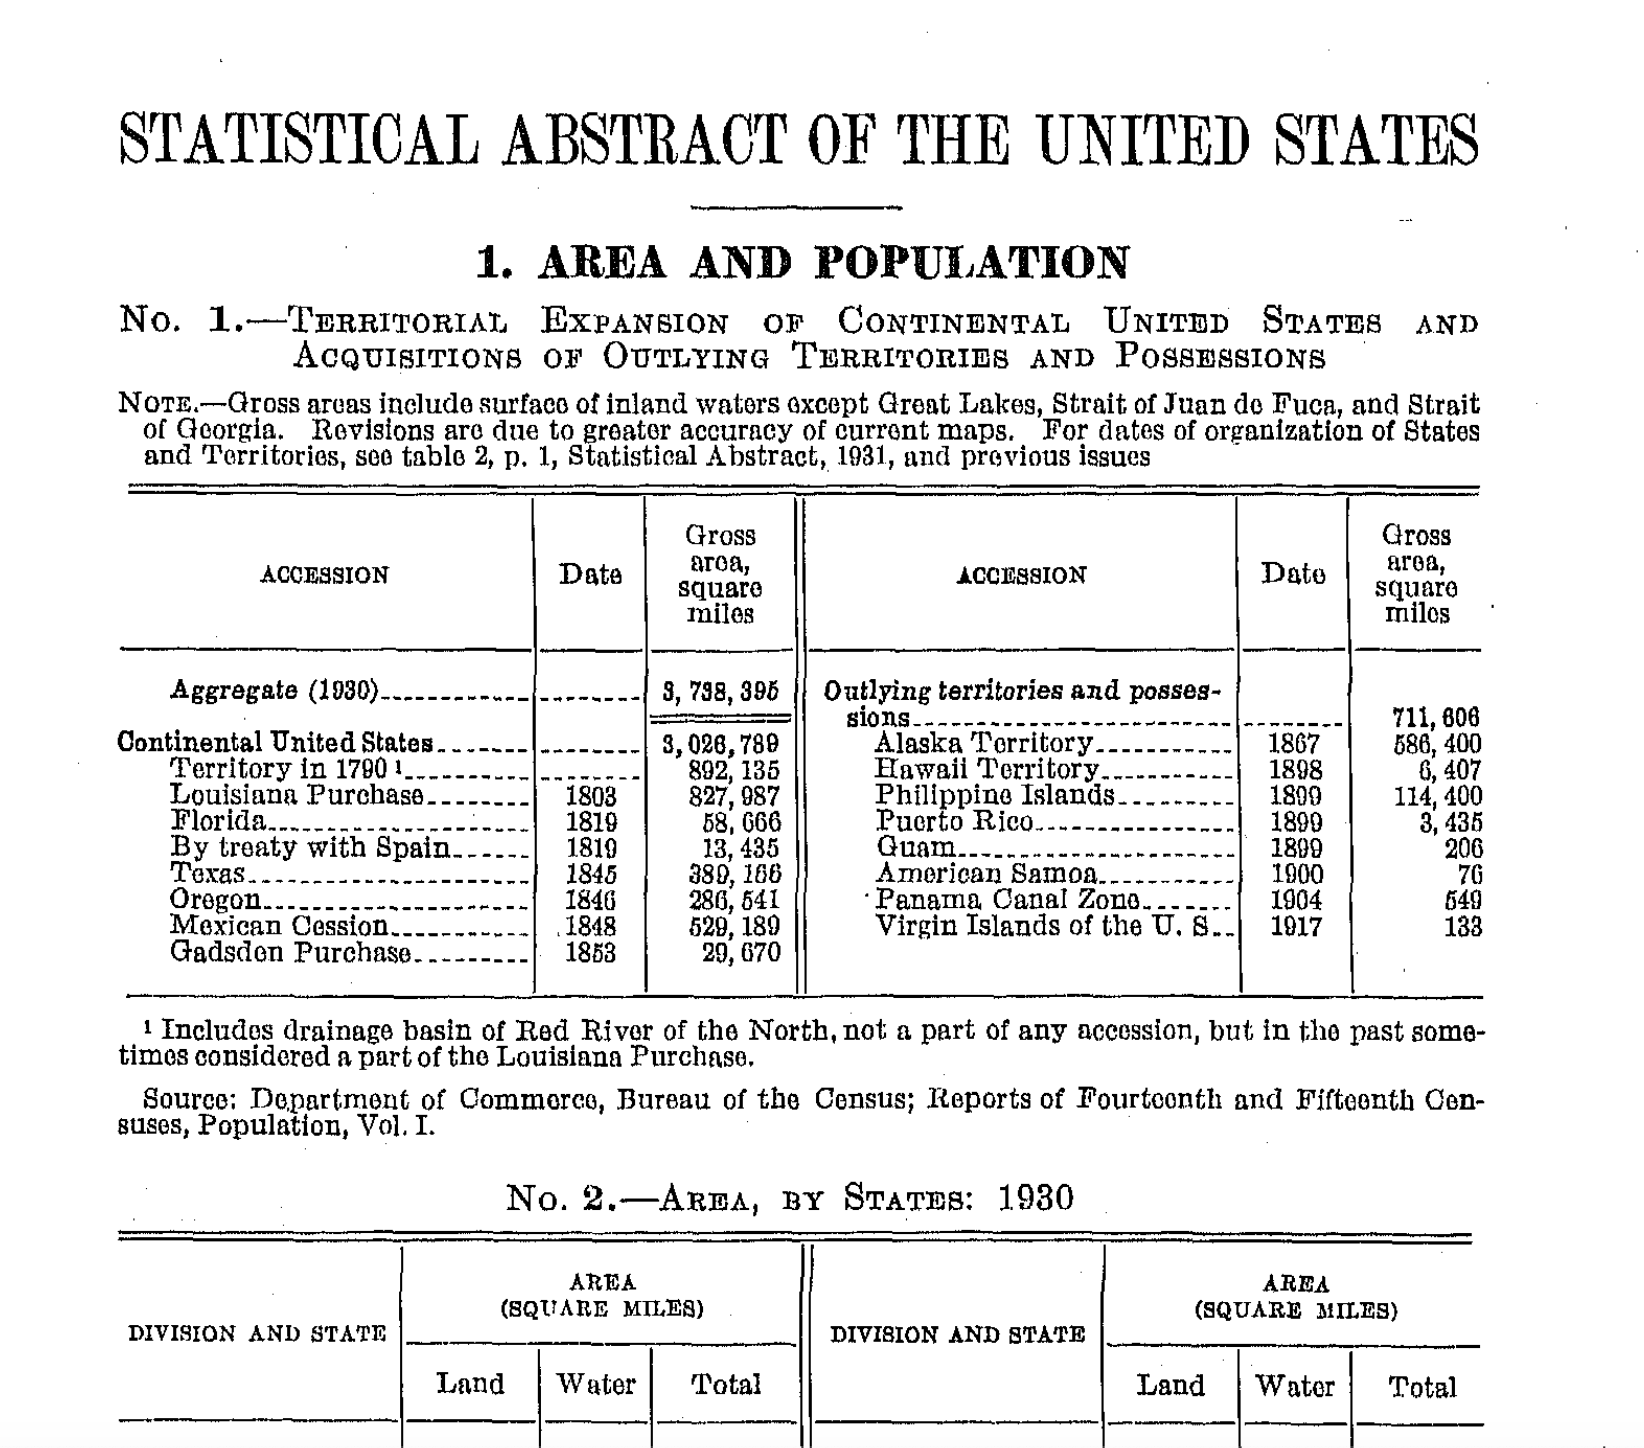
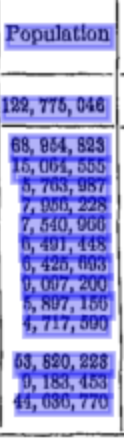
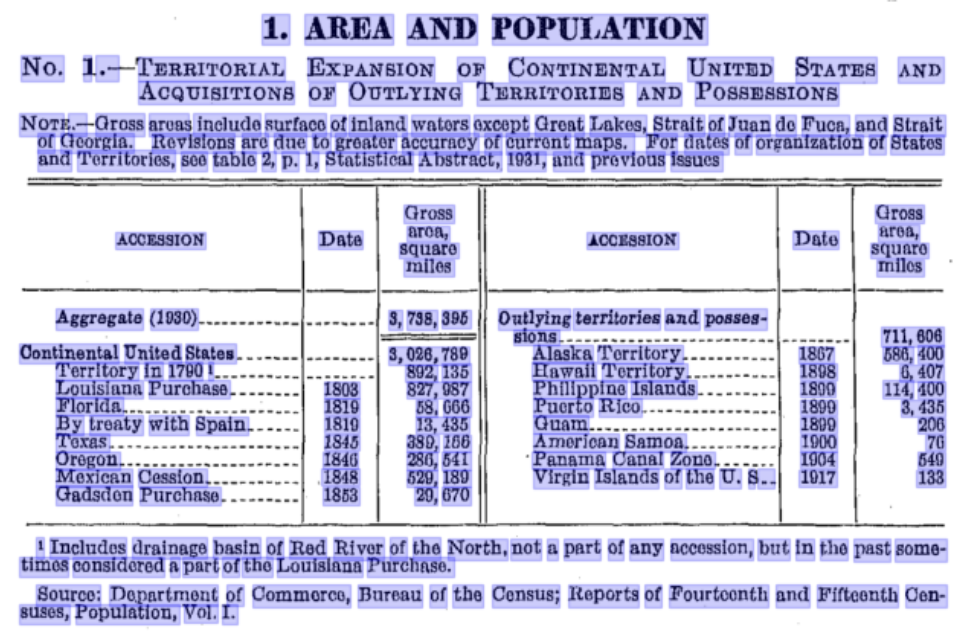
Here’s what they look like:
The Census Bureau has scanned these documents – so in that sense, they are already digitized – but has not attempted to perform OCR (to make the documents easily searchable) or publish the tables in a digitally native format (to make the data easier to work with). I wanted to give it a try. I’m not sure why, but I find this problem captivating – it really feels like something computers should be able to do well.
What did I want to do?
To start, I wanted to make these into “searchable PDFs” – essentially, OCR the content, and especially the numbers, at a high quality. Presumably this would, at the very least, help my friend find the numbers he’s looking for more easily.
In addition to simply OCRing these abstracts, I would love to be able to extract and convert the tables into a machine-readable tabular format (ie csv) to make them easier to work with.
What tools/services did I look at?
When my friend asked me if I could do this (circa 2019), I gave Tesseract a go, and found the results left something to be desired. I fairly quickly put it on the shelf, as it became clear that high-quality results would take a lot of effort.
More recently (circa 2024), I’ve been peripherally involved with the Decennial Census Digitization and Linkage (DCDL) project, which is in the process of digitizing the Census records from 1960, 1970, 1980, and 1990. This gave me an excuse to investigate the latest and greatest in OCR technology – and things have improved considerably.
In exploring the world of OCR, I discovered a variety of libraries and services doing OCR and related activities. In addition, Microsoft, Google, and Amazon have offerings in this universe through their cloud platforms. All groups seem to be using the latest and greatest in deep learning, plus their own special sauce.
A bit of digging and preliminary exploration led me to narrow down my interests to two major contenders: Microsoft and DocTR. In particular, DocTR has a helpful comparison table in their own documentation – thanks DocTR/Mindee (parent company) for making a great package!
I didn’t consider any layout recognition (ie identifying elements like titles, paragraphs, etc), table extraction (ie turning a table image into machine-readable, tabular data), or other related packages/models yet – I wanted to get a strong baseline of OCR to start. Given the goal I outlined, I’m definitely interested in table extraction from these documents in the future.
Starting out: DocTR
To start, I figured I’d explore DocTR a bit. It is open-source, easy-to-use, performant, and state-of-the-art (their README references all the papers they’ve implemented).
In its most basic case (a nicely aligned, typed document), DocTR does its OCR via a two-step process:
- Draw a box around every word in the image (OCR jargon: text detection)
- Recognize the text in each box (OCR jargon: text recognition)
Each of these tasks is performed by its own model – DocTR has a variety of models you can plug in for either task.
Attempt #1: Getting Started
As one does with any new package they’re getting acquainted with, my first attempt was to follow the “Getting Started” section of DocTR’s README. Something like this:
from doctr.io import DocumentFile
from doctr.models import ocr_predictor
model = ocr_predictor(pretrained=True)
doc = DocumentFile.from_pdf("1940_statistical_asbtract.pdf")
result = model(doc)
Lots of credit to DocTR – they have sensible defaults and make it easy to get started.
The results were pretty good. In the below image, however, you can immediately see an issue: the text detection is grabbing blocks that are too big. Each box should cover a single word (or in these tables, a single number). I drew a couple of red arrows pointing to an example box that is too big.
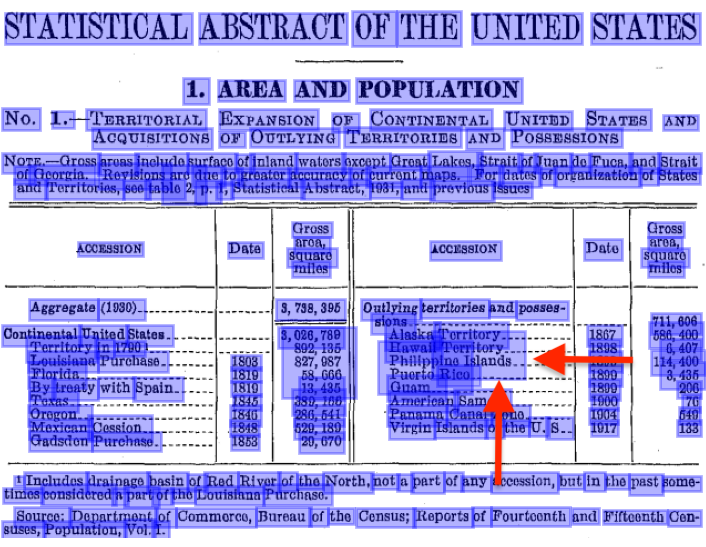
Looking at the actual text, there appears to be plenty of room for improvement as well. The results below, from the caption above the table, speak for themselves.

|
| NOTE.-Gross aroas include surfaco ofi inland wators axcept Groat Lakes, Strait of Juan do Fuca, and Strait of Georgia. Rovisions due to greator accuracy of curront maps. For dates of organization of States and Territories, soo tablo irgt p. 1, Statistical Abstract, 1931, and previous issues |
While my US geography could certainly be better, the last time I looked I didn’t see any Groat Lakes on the map.
Attempt #2: cropping
After fiddling with various parameters, trying different models from DocTR’s model zoo, etc. , I noticed something about the results. DocTR seemed to do better on the larger text in the scans. Furthermore, an initial preprocessing step for the detection model is to standardize image size (I believe to 1024x1024). These scans have margins of 2-300px of whitespace, which means that whitespace is taking up valuable real-estate in the standardized image. I developed an extremely low-budget cropping algorithm, based on the fact that these scans are b/w and relatively clean. I’ll spare you the details, but here is the before/after.
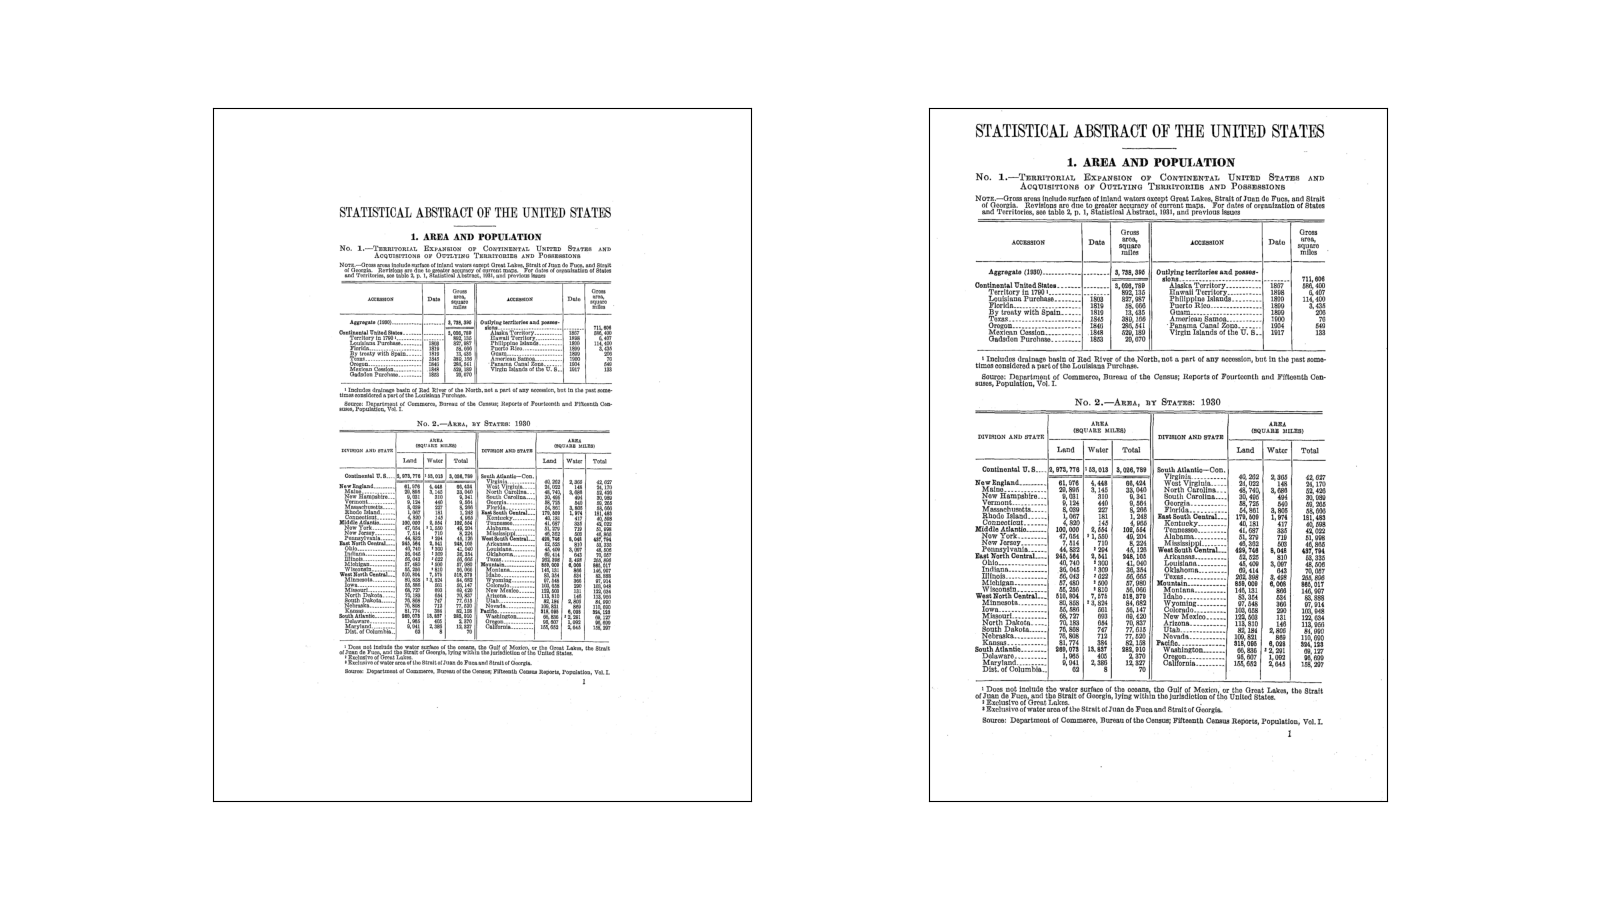
Could definitely do better, but we’ve cleared out most of the junky whitespace. Hopefully this gives the model more signal to work from.
Looking at the same result as earlier, it seems cropping helps! Notice the oversized boxes are gone. Interestingly, the text recognition looked a bit better too… probably the result of better bounding boxes.
Before cropping: oversized detection boxes don't work. |
After cropping: oversized detection boxes are gone. |
Attempt #3: fine-tuning
While some preprocessing tricks were helping, I still had issues. The detection wasn’t fantastic on more difficult tables/pages, and numbers were not super high quality. In particular, the OCR recognition’s (ie word -> text) initial accuracy was 89% (spoiler alert: I hand labeled a ground-truth dataset to come up with this number, and do the fine-tuning). While the text example I gave above might be correctable via clever spell-checking, post-processing, or may not even matter… incorrect numbers would render digital versions of these documents substantially less useful.
In this example, the detection is combining numbers across table columns in weird ways... and in other places, splitting up numbers inappropriately. This frequently happens in the images where these tables have little margin. |
Some example misrecognized numbers. It really is hard to tell with some of these scans. |
SO, it was time to get my hands dirty and attempt to fine-tune the models DocTR uses. This also gave me the opportunity to do this as a real data project – set up quality metrics for the different parts of the pipeline I care about, measure those metrics, and hopefully improve upon them.
As mentioned above, DocTR uses a 2-stage pipeline, which means we have 2 models to fine-tune: the model for drawing the bounding boxes (text detection), and the model for actually OCRing the text inside each of those boxes (text recognition).
DocTR has reasonably nice infrastructure for fine-tuning their models. I used Label Studio to clean up the bounding boxes and to create the recognition ground-truth dataset.
Fine tuning text detection (the bounding boxes)
I’ll spare you the gory details and just give you the before/after. I created a dataset of just 9 pages’ worth of bounding boxes. Let me tell you, this was very unpleasant to do.
Here are performance metrics on a held-out validation page:
| Recall | Precision | |
|---|---|---|
| Before fine-tuning | 86% | 75% |
| After fine-tuning | 97% | 96% |
The numbers are up! Better precision means that when we predict a bounding box, it is correct, and better recall means we find more of the bounding boxes in our ground-truth dataset. Here’s an example (out-of-sample) table before/after fine-tuning (and illustrating some of the wonky number splitting in the baseline model):
Before fine-tuning |
After fine-tuning -- much better |
On the left (before fine-tuning), you can the see too-large boxes and split numbers that I’ve been highlighting in other examples – this won’t do! After fine-tuning, on the right, things look pretty much perfect.
Remember, this was just 9 pages’ worth of labelled data. (Though admittedly each page has a lot of bounding boxes to work with). I also think I could better tune hyperparemeters to squeeze a little more performance out of the model. Finally, the model does give a score of how confident it is (an objectness_score), though I primarily see post-processing QA applications for this score vs. using it to improve model performance.
Fine tuning text recognition (the actual OCR)
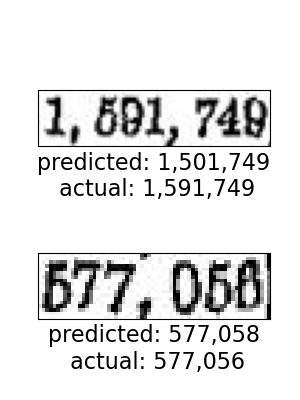
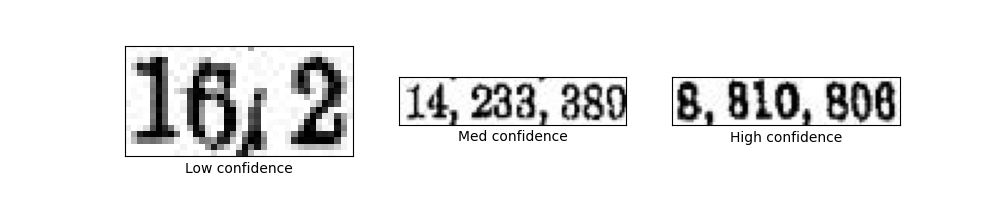
After getting detection working better, it was time to fine-tune OCR. The labelling process for this one was much easier, and this is generally a simpler ML problem (given an image representing a word, output the word). I took a sampling of about 300 words to label, specifically targeting records the model wasn’t confident on (we get a confidence score for each prediction).
Here are some example images. Again, these are crops from the pages, as determined by the bounding boxes we get back from detection. Note how the first image has some sort of artifact in the scan that makes what should be a decimal look like… a slash, or something else. The model was not very confident on this image.
Again, sparing you the gory details of hand-labelling and training, here are the results on a held-out validation set:
| Accuracy | # correct | # samples | |
|---|---|---|---|
| Before fine-tuning | 54% | 20 | 37 |
| After fine-tuning | 97% | 36 | 37 |
In particular, we got 36/37 on the validation set correct! And the one missed was the first example image with the messy scan artifact. In a production application, it’d be easy enough to use model confidence (the model remained low-confidence on that image) to flag concerning images for human review. Also worth noting that the single error was incorrectly identifying the . character as a : (something we could probably fix with post-processing).
End-to-end
Now, having fine-tuned both stages of the pipeline, I looked at the results in totality to see how well we could actually OCR pages (you know, the thing we actually care about). Here is how things look overall with detection in our first table:
And, our example text. Much better.
|
|
| NOTE. - Gross areas include surface of inland waters Gxcept Great Lakes, Strait of Juan de Fuca, and Strait of Georgia. Revisions arc due to greater accuracy of current maps. For dates of organization of States and Territories, see table 2, p. 1, Statistical Abstract, 1931, and previous issues. |
The bottom line: how good is it?
Finally, I hand-labelled a full page’s worth of recognition images to be able to evaluate the end-to-end performance of the finetuned pipeline on a full page. This was much easier than the first round of hand-labelling, because the fine-tuned model is so good!
Here are the results. A massive improvement.
| Recall | Precision | |
|---|---|---|
| Before fine-tuning | 61% | 53% |
| After fine-tuning | 92% | 91% |
If you’ve been following, you would have noticed the finetuned detection has precision/recall of roughly 97% on each page, and the recognition is 99% accurate. However, combining the two steps essentially compounds errors in both processes, leading to slightly lower, but still very good, numbers.
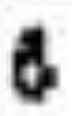
As an aside, while I was hand-labelling a page for end-to-end results, I couldn’t believe some of the characters the finetuned OCR was able to recognize. I had to go look at a whole bunch of context to confirm these superscript characters referencing footnotes, for example.

|
|
Commercial OCR (Microsoft) comparison
So, DocTR (with fine-tuning) looks really good, and is relatively easy. However, according to DocTR’s own documentation, Microsoft has the best OCR at the moment (at least among the big 3 cloud service providers). If my PhD-seeking friend really wants to digitize the Statistical Abstracts of the United States, should he just pay Microsoft? Let’s find out.
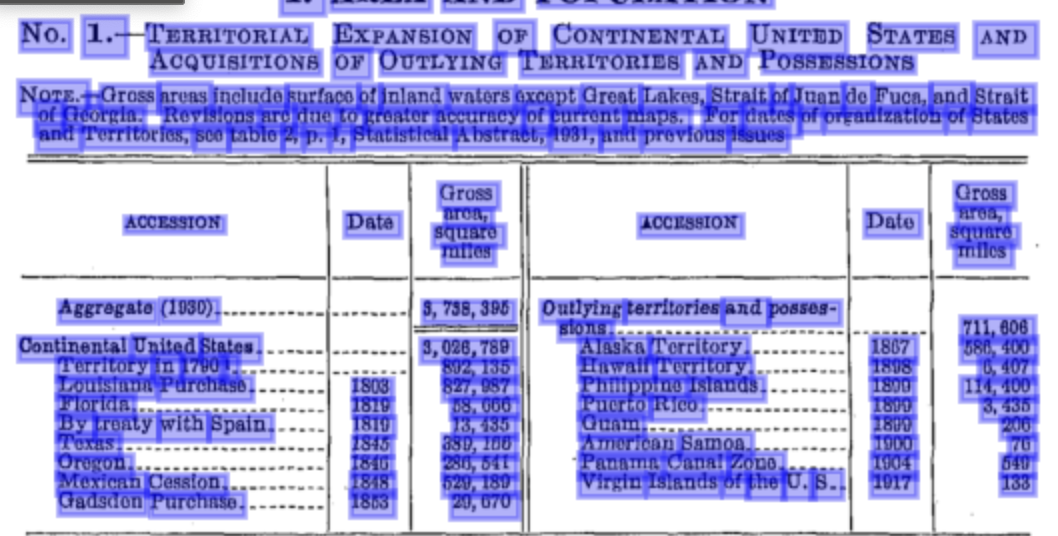
First off, Microsoft’s object detection looks really good at first blush. Here is the first table, with bounding boxes drawn on it.
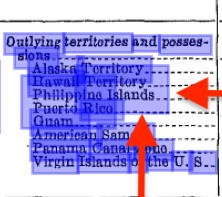
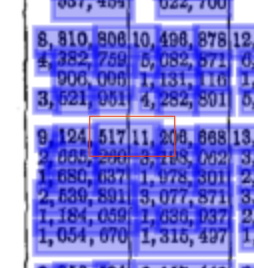
However, one issue will cause challenges for digitizing these documents: it separates numbers out into constitutent components. We could potentially fix this with post-processing, but it is more effort.
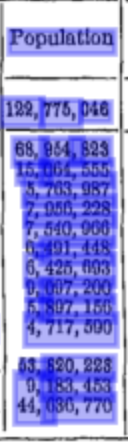
The OCR is pretty good. It was perfect on the “Gross areas include…” text example I’ve been using through this post – I think Microsoft is running through a spellchecker (or some LLM thing or whatever). That said, similar to DocTR, it does mistake some numbers in the table. For example, it mistakes the 3 for a 9 in the very first statistic. Here is the table from Microsoft (in addition to straight up OCR, Microsoft does table extraction, and it is pretty good, so enjoy!). You can compare its results to the screenshot above and find a few errors. I bolded a couple that I noticed. You can also see the spaces between numbers because they were detected as separate tokens.
|
ACCESSION
|
Date
|
Gross aroa, square miles
|
ACCESSION
|
Date
|
Gross area, square milos
|
|
Aggregate (1930)
|
|
3, 798, 395
|
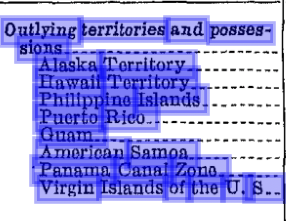
Outlying territories and posses-
|
|
|
|
|
|
|
sions
|
|
711,606
|
|
Continental United States
|
|
3,026,789
|
Alaska Territory
|
1867
|
586, 400
|
|
Territory in 1790 1
|
|
892, 135
|
Hawaii Territory
|
1898
|
6,407
|
|
Louisiana Purchase
|
1803
|
827,987
|
Philippine Islands
|
1899
|
114, 400
|
|
Florida
|
1819
|
58, 666
|
Puerto Rico
|
1899
|
3,435
|
|
By treaty witd Spain.
|
1819
|
13, 435
|
Quam
|
1899
|
206
|
|
Texas
|
1845
|
389, 166
|
American Samoa.
|
1900
|
7G
|
|
Oregon
|
1846
|
286, 541
|
Panama Canal Zone.
|
1904
|
649
|
|
Mexican Cession
|
1848
|
529, 189
|
Virgin Islands of tde U. S ..
|
1917
|
133
|
|
Gadsden Purchase
|
1853
|
29, 670
|
|
|
|
I compared its detection performance to my ground-truth dataset. MS is definitely better out-of-the-box. AFAIK you cannot fine-tune Microsoft’s OCR models (you can create custom models for information extraction tasks, but that is another blog post).
These results somewhat underrepresent MS’ performance, in my opinion – in particular, MS’ detection is separating out single numbers into multiple tokens as shown above. That said, finetuning gets it 96% right without any further effort required (vs. needing to do post-processing with MS’ detection to combine those separated numbers).
| Detection recall | Detection precision | |
|---|---|---|
| MS (out of the box, all pages) | 82% | 62% |
| DocTR (out of the box, all pages) | 59% | 36% |
| MS (out of the box, validation page only) | 71% | 49% |
| DocTR (finetuned, validation page only) | 97% | 96% |
I attempted to evaluate MS’ recognition on its own merits by comparing instances where my labeled bounding boxes overlapped MS’ bounding boxes closely enough that they would be recognizing basically the same text. The main places the bounding boxes don’t overlap “enough” to be comparable is the table numbers (where MS breaks them apart)… which is also where both MS and out-of-the-box DocTR perform the worst. So overall MS and out-of-the-box DocTR are probably a little worse than represented by these numbers.
| Model | Recognition Accuracy (on words in ~200 overlapping, hand-labelled bounding boxes) |
|---|---|
| MS (out-of-the-box) | 87% |
| DocTR (out-of-the-box) | 71% |
| DocTR (fine-tuned) | 99% |
And finally, end-to-end performance on the validation page. Again, MS is underrated here because of its issue with separating out numbers in detection. But if I were making a professional recommendation on how to do this… I’d fine-tune.
| Recall | Precision | |
|---|---|---|
| DocTR (out-of-the-box) | 61% | 53% |
| DocTR (fine-tuned) | 92% | 91% |
| MS (out-of-the-box) | 56% | 39% |
Conclusion + next steps
Fine-tuning works really well. We were able to boost OCR performance on noisy historical documents by a good margin, with minimal effort. A fine-tuned pipeline significantly outperforms a well-regarded commercial offering.
While, sadly, my friend has completed his PhD, I think I would be comfortable giving him the OCR’d statistical abstracts using this pipeline, and would imagine it’d have made his life a little easier. Sorry I’m late, Alex.
Going forward, I am thinking I’ll:
- Use this pipeline (maybe with a little more fine-tuning if necessary) to digitize the corpus of abstracts.
- Investigate table extraction and see how well I can make that work well enough.
Furthermore, we can measure performance and identify low-confidence predictions for further fine-tuning, human intervention, or other correction if necessary. With MS’ commercial offering, you can identify low-confidence predictions, but have to fix them with post-processing and can’t fine-tune their OCR models. I can imagine a human-in-the-loop pipeline that makes this entire process easy, improving the model with human feedback and giving metrics about digitization quality based on minimal human labelling.
With that in mind, I want to work on a toolkit to make this really easy to do for any set of documents. If you’re interested in using such a thing, I’m looking for use cases, so feel free to reach out to [email protected].
If you’ve gotten this far, source is here: https://github.com/cmoscardi/stat-abstract-explore
Disclaimer: While I work at the Census Bureau, this was a side project for me. I’ve received no money or support to work on this, all views in the post are my own, etc. etc.